Get Exclusive App Deals
Uruma


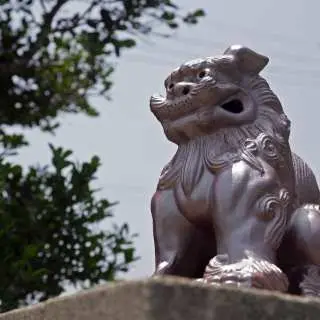
Top 10 Must-Do Experiences and Attractions in Uruma


![[Official Sale] Katsuren Castle Ruins Admission Ticket (Uruma City, Okinawa Prefecture)](https://image.kkday.com/image/get/c_fill%2Ch_153%2Cq_55%2Ct_webp%2Cw_272/s1.kkday.com/product_172948/20240510083108_XJDcF/jpg)


![[Okinawa, Tsuken Island] A plan to enjoy BBQ and boat snorkeling on a wooden deck terrace with ocean views from all seats!](https://image.kkday.com/image/get/c_fill%2Ch_153%2Cq_55%2Ct_webp%2Cw_272/s1.kkday.com/product_548751/20251127060719_dU4P1/png)
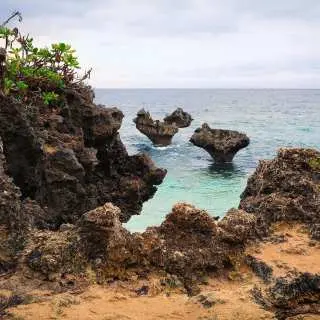
Uruma Trending place to visit

Latest launches and promotions in Uruma
![[Okinawa, Kerama Islands] World-class clarity! Jet ski & snorkeling experience at Hamahiga Island - Scenic jet ski experience | Beginners welcome, free photo and video recording](https://image.kkday.com/image/get/c_fill%2Ch_153%2Cq_55%2Ct_webp%2Cw_272/s1.kkday.com/product_651040/20260730055233_OWQ1k/jpg)
![[Okinawa, Uruma City] Experience making ocean-themed resin art glass! Same-day reservations accepted.](https://image.kkday.com/image/get/c_fill%2Ch_153%2Cq_55%2Ct_webp%2Cw_272/s1.kkday.com/product_635770/20260728022138_uh7jk/png)
![[Okinawa, Uruma City] Okinawa Ocean Resin Art Experience | Choose your favorite design on the day - from 6,000 yen](https://image.kkday.com/image/get/c_fill%2Ch_153%2Cq_55%2Ct_webp%2Cw_272/s1.kkday.com/product_635769/20260728022106_iiYCv/png)
![[Okinawa, Uruma City] 4-Hour Private Charter - Basic | Uninhabited Island & Snorkeling - Plenty of Time, No Equipment Needed](https://image.kkday.com/image/get/c_fill%2Ch_153%2Cq_55%2Ct_webp%2Cw_272/s1.kkday.com/product_635128/20260723125249_89nfM/jpg)
![[Okinawa, Tsuken Island] Enjoy extremely rare activities! Choose your meal & marine sports♪ Activity plan](https://image.kkday.com/image/get/c_fill%2Ch_153%2Cq_55%2Ct_webp%2Cw_272/s1.kkday.com/product_615504/20260630121328_0iYsu/jpg)
![[Okinawa, Tsuken Island] New Plan ☆ A must-see for those who want to scream...! Enjoy your choice of meals and thrilling marine sports!](https://image.kkday.com/image/get/c_fill%2Ch_153%2Cq_55%2Ct_webp%2Cw_272/s1.kkday.com/product_615501/20260630121247_YeBEs/jpg)
![[Uruma City] 10 types of marine sports ★ All-day private rental with unlimited fun (no limit on the number of people!!)](https://image.kkday.com/image/get/c_fill%2Ch_153%2Cq_55%2Ct_webp%2Cw_272/s1.kkday.com/product_615476/20260630120739_7dNa4/jpg)

![Fishing on a jet ski!? [Fishing-focused jet ski rental 1-day plan]](https://image.kkday.com/image/get/c_fill%2Ch_153%2Cq_55%2Ct_webp%2Cw_272/s1.kkday.com/product_615379/20260630115134_SsCPX/jpg)

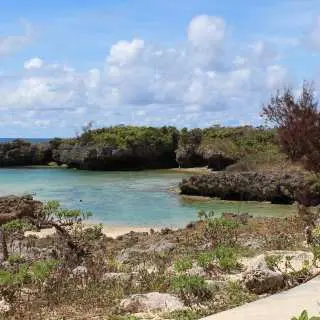
Recommended travel destinations near Uruma
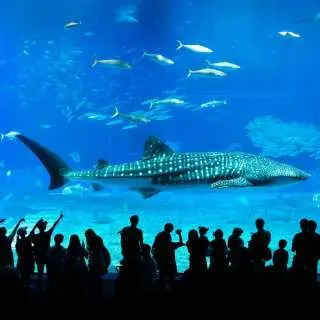
Reviews of Uruma activities

Uruma Weather, Climate and Best Time to Visit
Data source:Meteostat
Update date:2025-09
Uruma year round climate
- Spring (March–May): Average 66–75°F, warm and humid climate with gradually increasing rainfall. Common activities: Beach walks, flower viewing (depending on the flower species). Recommended clothing: Light long-sleeved clothing, light jacket.
- Summer (June–August): Average 80–85°F, hot and humid, with heavier rainfall, particularly in June. Common activities: Swimming, water activities, avoiding afternoon thunderstorms. Recommended clothing: Light and breathable clothing, sun protection clothing, rain gear.
- Autumn (September–November): Average 78–72°F, pleasant and comfortable climate with gradually decreasing rainfall. Common activities: Outdoor activities, exploring natural attractions. Recommended clothing: Long-sleeved shirts, light jacket.
- Winter (December–February): Average 61–64°F, mild climate with relatively low rainfall. Common activities: Beach walks, sightseeing. Recommended clothing: Long-sleeved clothing, light jacket.
Uruma climatological average
Annual average temperature: approx. 74.3°F / Annual rainfall: approx. 3221 mm / Summer humidity: 75%–85% / Rainiest month: June
Uruma monthly average temperature and precipitation
Month
Air temperature (°F)
Precipitation (mm)
January
61.9°F
92.2
February
64.4°F
132.2
March
66.6°F
217.9
April
72.7°F
245.3
May
75.2°F
458.5
June
80.6°F
598.3
July
85.3°F
230.9
August
84.7°F
324
September
82.9°F
311.8
October
78.8°F
225.2
November
72.9°F
210.2
December
64.6°F
175
Uruma weather for the next seven days
8/3
Monday
Patchy rain nearby
88°F/82.3°F
8/4
Tuesday
Patchy rain nearby
87.8°F/82.7°F
8/5
Wednesday
Patchy rain nearby
88°F/82.5°F
8/6
Thursday
Patchy rain nearby
86.8°F/83.7°F
8/7
Friday
Light rain shower
84.2°F/83°F
8/8
Saturday
Moderate or heavy rain in area with thunder
84.8°F/83.2°F
8/9
Sunday
Heavy rain
85.4°F/82.9°F
