Get Exclusive App Deals
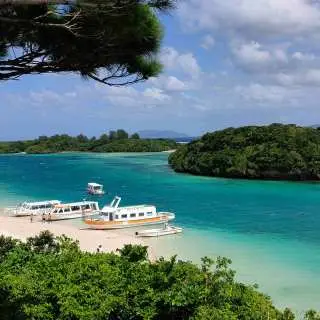
Kabira Bay


Top 10 Must-Do Experiences and Attractions in Kabira Bay


![[Okinawa, Ishigaki Island] Kabira Bay Sea Kayaking & Waterfall Refreshment ☆ Emerald Green Sea and Cool Waterfall Play ♪](https://image.kkday.com/image/get/c_fill%2Ch_153%2Cq_55%2Ct_webp%2Cw_272/s1.kkday.com/product_551685/20251202040451_ZdGkT/png)
Latest launches and promotions in Kabira Bay
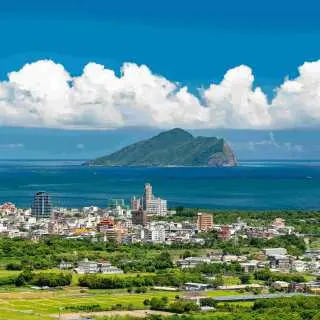
Recommended travel destinations near Kabira Bay


Reviews of Kabira Bay activities


Kabira Bay Weather, Climate and Best Time to Visit
Data source:Meteostat
Update date:2025-09
Kabira Bay year round climate
- Spring (March–May): Average 70–78°F, mild and comfortable climate, rainfall gradually increases, with more rainfall in May. Common activities: diving, snorkeling, beach walks. Recommended clothing: light long-sleeved clothing, light jacket.
- Summer (June–August): Average 83–86°F, hot and humid, relatively less rainfall, but occasional showers. Common activities: swimming, sunbathing, water sports. Recommended clothing: light and breathable clothing, swimwear, hat, sunscreen.
- Autumn (September–November): Average 75–83°F, pleasant climate, September has the most rainfall, which gradually decreases afterwards. Common activities: enjoying natural scenery, outdoor leisure activities. Recommended clothing: comfortable and breathable long-sleeved clothing, light jacket.
- Winter (December–February): Average 66–68°F, warm climate, moderate rainfall. Common activities: diving, snorkeling, birdwatching. Recommended clothing: light jacket, long-sleeved clothing.
Kabira Bay climatological average
Annual average temperature: approx. 77.0°F / Annual rainfall: approx. 2232 mm / Summer humidity: 70%–80% / Rainiest month: September
Kabira Bay monthly average temperature and precipitation
Month
Air temperature (°F)
Precipitation (mm)
January
66.7°F
96.7
February
68°F
123.3
March
70.9°F
98.3
April
76.3°F
113
May
78.3°F
333.7
June
83.7°F
195.7
July
86.5°F
148.3
August
86.2°F
177.3
September
83.8°F
354
October
80.6°F
231.7
November
75.9°F
203.3
December
68.7°F
157
Kabira Bay weather for the next seven days
7/20
Monday
Patchy rain nearby
84.3°F/83.2°F
7/21
Tuesday
Patchy rain nearby
84.4°F/83.3°F
7/22
Wednesday
Patchy rain nearby
84.2°F/83.3°F
7/23
Thursday
Sunny
83.8°F/82.8°F
7/24
Friday
Partly Cloudy
83.6°F/82°F
7/25
Saturday
Patchy rain nearby
83.1°F/81.8°F
7/26
Sunday
Partly Cloudy
83.2°F/81.8°F
