Get Exclusive App Deals
Kurima Island


Top 10 Must-Do Experiences and Attractions in Kurima Island
![[Okinawa, Miyakojima] Night snorkeling, mysterious sea fireflies, bioluminescent plankton and starry skies like space travel, beginners welcome](https://image.kkday.com/image/get/c_fill%2Ch_153%2Cq_55%2Ct_webp%2Cw_272/s1.kkday.com/product_552893/20251202071602_xScov/png)

![[Okinawa, Miyakojima] Blue Cave & Bijyas! Boat Snorkeling Course](https://image.kkday.com/image/get/c_fill%2Ch_153%2Cq_55%2Ct_webp%2Cw_272/s1.kkday.com/product_553374/20251202083026_4J32L/png)

![[Miyakojima ★ Night] A great night adventure! ★ Night snorkeling tour! An extraordinary experience ★ Recommended even for beginners ♪ Starry sky ★ Noctiluca](https://image.kkday.com/image/get/c_fill%2Ch_153%2Cq_55%2Ct_webp%2Cw_272/s1.kkday.com/product_552639/20251202063627_2aERg/png)
![IB [Okinawa/Miyako Island] Take a boat trip to [Uni Beach] with a 100-megapixel drone! Enjoy a short cruise departing from the marina and passing under the Irabu Bridge. Free drone photography.](https://image.kkday.com/image/get/c_fill%2Ch_153%2Cq_55%2Ct_webp%2Cw_272/s1.kkday.com/product_551659/20260612051112_LuIQl/jpg)
![[Miyakojima/Pickup available] ★Same-day reservations accepted★ [Very popular! Luxury snorkeling with sea turtles, Nemo, and coral] <Wetsuit fee included!>](https://image.kkday.com/image/get/c_fill%2Ch_153%2Cq_55%2Ct_webp%2Cw_272/s1.kkday.com/product_551917/20251202044111_MVYBV/png)

![[Miyakojima/Pickup available] ★Same-day reservations accepted★ [Great value Miyakojima enjoyment plan! Sea turtle snorkeling + beach SUP] Free pick-up, photos, and video data!](https://image.kkday.com/image/get/c_fill%2Ch_153%2Cq_55%2Ct_webp%2Cw_272/s1.kkday.com/product_551789/20251202041949_jZwJ9/png)
![[Okinawa, Miyakojima] Jet Ski Tour to Uni Beach. Free drone photography! Parking, water, and simple changing rooms available.](https://image.kkday.com/image/get/c_fill%2Ch_153%2Cq_55%2Ct_webp%2Cw_272/s1.kkday.com/product_553447/20251202084134_zyAlj/png)
Latest launches and promotions in Kurima Island
![[Miyako Island/Charm Bracelet Making Experience] Same-day reservations OK!! Bracelet making experience! Perfect for a girls' trip or with friends! Make a stylish bracelet that's perfect for a tropical getaway.](https://image.kkday.com/image/get/c_fill%2Ch_153%2Cq_55%2Ct_webp%2Cw_272/s1.kkday.com/product_604998/20260617095316_b62u7/png)
![[Miyako Island] Professional Guide-Operated Jet Ski Tour to Uni Beach (approx. 1 hour)](https://image.kkday.com/image/get/c_fill%2Ch_153%2Cq_55%2Ct_webp%2Cw_272/s1.kkday.com/product_604850/20260617021313_BJoJd/jpg)
![[Okinawa/Miyako Island] Miyako Island Parasailing | Enjoy the Miyako Blue from the sky!!](https://image.kkday.com/image/get/c_fill%2Ch_153%2Cq_55%2Ct_webp%2Cw_272/s1.kkday.com/product_604803/20260616234547_2qPNP/jpg)
![[Okinawa, Miyako Island] ~Book at a time that suits you~ Experience making salt from seawater in Miyako Island☆Conveniently located just a 5-minute drive from Miyako Airport, making it a great experience for your last day♪](https://image.kkday.com/image/get/c_fill%2Ch_153%2Cq_55%2Ct_webp%2Cw_272/s1.kkday.com/product_572399/20260316081813_MwK7N/jpg)
![[Okinawa, Miyako Island] ~Book at a time that suits you~ Glass Resin Art Experience! Experience the very popular resin art in glass☆Conveniently located just a 5-minute drive from Miyako Airport♪](https://image.kkday.com/image/get/c_fill%2Ch_153%2Cq_55%2Ct_webp%2Cw_272/s1.kkday.com/product_572398/20260613082301_RJz9N/jpg)
![[Okinawa, Miyako Island] ~Book at a time that suits you!~ Experience ocean resin art! Create a beautiful piece of art inspired by the ocean of Miyako Island with our popular 'Clock Resin Art'!](https://image.kkday.com/image/get/c_fill%2Ch_153%2Cq_55%2Ct_webp%2Cw_272/s1.kkday.com/product_572397/20260613084039_a2gpy/jpg)

![[Even better deals on Mondays] A full day of Miyako Island fun! Enjoy three popular tours – sea turtles, SUP, and a night tour – all in one great package! Ages 0-70 welcome.](https://image.kkday.com/image/get/c_fill%2Ch_153%2Cq_55%2Ct_webp%2Cw_272/s1.kkday.com/product_602519/20260617101357_IFdvm/jpg)

!["Miyako Island Sunset Stunning View" Exclusively Offered by Our Company: [Luxury Private Charter Plan for Up to 3 People, One Group Per Day] Sunset Parasailing ★ Same-Day Reservations OK ~A Special Time with Your Loved One~](https://image.kkday.com/image/get/c_fill%2Ch_153%2Cq_55%2Ct_webp%2Cw_272/s1.kkday.com/product_601390/20260612091311_R1moM/jpg)
Recommended travel destinations near Kurima Island

Reviews of Kurima Island activities
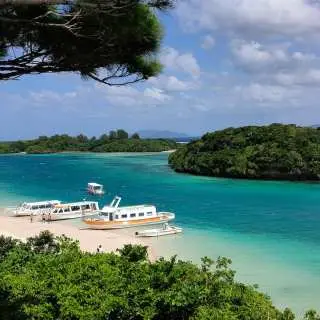
![IB [Okinawa/Miyako Island] Take a boat trip to [Uni Beach] with a 100-megapixel drone! Enjoy a short cruise departing from the marina and passing under the Irabu Bridge. Free drone photography.](https://image.kkday.com/v2/image/get/w_600%2Cc_fit/s1.kkday.com/product_551659/20260521062225_GSwVT/jpg)
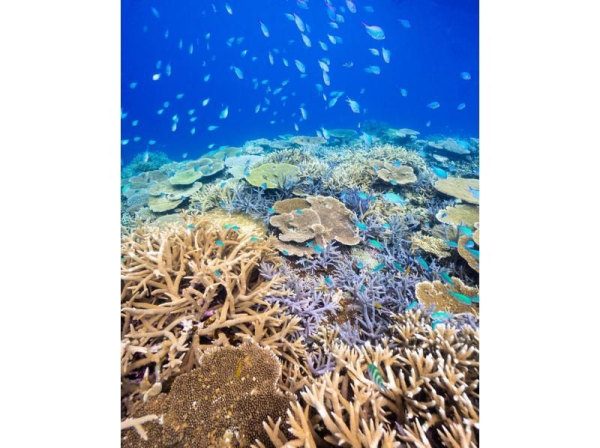
![[Miyakojima/Pickup available] ★Same-day reservations accepted★ [Great value Miyakojima enjoyment plan! Sea turtle snorkeling + beach SUP] Free pick-up, photos, and video data!](https://image.kkday.com/v2/image/get/w_600%2Cc_fit/s1.kkday.com/product_551789/20251202041949_jZwJ9/png)
Kurima Island Weather, Climate and Best Time to Visit
Data source:Meteostat
Update date:2025-09
Kurima Island year round climate
- Spring (March–May): Average 69–77°F, warm and humid climate. May has the most rainfall; rain gear is recommended. Common activities: Beachcombing, diving, whale and dolphin watching. Suggested clothing: Light and breathable clothing, rain gear.
- Summer (June–August): Average 82–85°F, hot and humid with occasional showers. Common activities: Swimming, surfing, water sports. Suggested clothing: Light short sleeves, shorts, sandals, sunscreen.
- Autumn (September–November): Average 80–75°F, pleasant and comfortable climate, more rainfall. Common activities: Hiking, stargazing, sunset watching. Suggested clothing: Long-sleeved shirts, light jackets.
- Winter (December–February): Average 68–65°F, warm and comfortable with occasional rainfall. Common activities: Sea fishing, bird watching. Suggested clothing: Light jacket, long pants.
Kurima Island climatological average
Annual average temperature: approx. 75.9°F / Annual rainfall: approx. 2698 mm / Summer humidity: 75%–85% / Rainiest month: May
Kurima Island monthly average temperature and precipitation
Month
Air temperature (°F)
Precipitation (mm)
January
65.7°F
96.7
February
66.9°F
121
March
69.4°F
126.7
April
74.8°F
198
May
77°F
569.7
June
82.2°F
185
July
85.5°F
86.7
August
84.7°F
293.7
September
82.8°F
270
October
80.1°F
223.7
November
75.2°F
276.7
December
68°F
251
Kurima Island weather for the next seven days
6/19
Friday
Sunny
81.6°F/80.7°F
6/20
Saturday
Sunny
82°F/80.7°F
6/21
Sunday
Patchy rain nearby
82.3°F/80.9°F
6/22
Monday
Sunny
82°F/80.7°F
6/23
Tuesday
Sunny
82°F/80.2°F
6/24
Wednesday
Patchy rain nearby
82°F/80.5°F
6/25
Thursday
Patchy rain nearby
82°F/81.2°F
