Get Exclusive App Deals
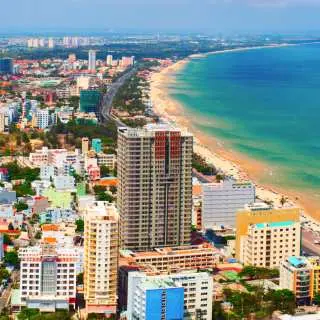
Ba Ria Vung Tau


Top 10 Must-Do Experiences and Attractions in Ba Ria Vung Tau


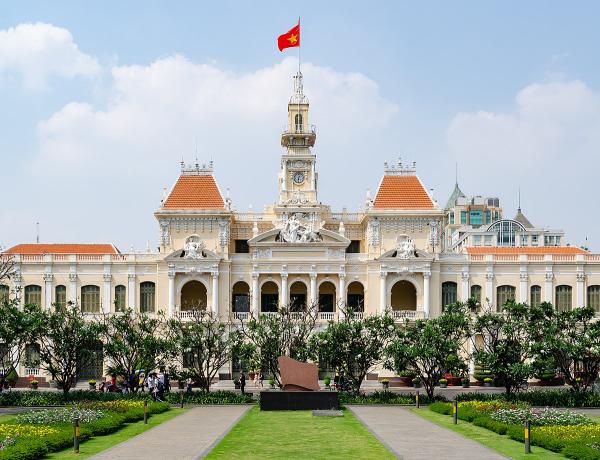
![[Guaranteed Departure for 1][KKday Signature Tour] Vung Tau Day Tour - Explore Statue of Christ the King/ White Palace with Multiple Language Options | From Ho Chi Minh, Vietnam](https://image.kkday.com/image/get/c_fill%2Ch_153%2Cq_55%2Ct_webp%2Cw_272/s1.kkday.com/product_285707/20260417104231_P0Y1T/jpg)


Ba Ria Vung Tau Trending place to visit


Latest launches and promotions in Ba Ria Vung Tau


Recommended travel destinations near Ba Ria Vung Tau

Reviews of Ba Ria Vung Tau activities
Ba Ria Vung Tau Weather, Climate and Best Time to Visit
Data source:Meteostat
Update date:2025-09
Ba Ria Vung Tau year round climate
- Spring (March to May): Average 27.6–30.0°C, hot and dry climate with minimal rainfall. Common activities: Beach activities, watersports, sightseeing. Recommended clothing: Light and breathable clothing, sun hat, sunglasses.
- Summer (June to August): Average 27.4–28.6°C, hot and humid climate with occasional rainfall. Common activities: Swimming, sunbathing, enjoying the sea breeze. Recommended clothing: Light and breathable clothing, sun-protective clothing.
- Autumn (September to November): Average 27.2–27.3°C, mild climate with little rainfall. Common activities: Outdoor activities, sightseeing, enjoying food. Recommended clothing: Light and comfortable clothing.
- Winter (December to February): Average 25.7–26.6°C, warm and dry climate with minimal rainfall. Common activities: Beach relaxation, sightseeing. Recommended clothing: Light and comfortable clothing, a light jacket may be needed in the mornings and evenings.
Ba Ria Vung Tau climatological average
Annual average temperature: approx. 27.6°C / Annual rainfall: approx. 52 mm / Summer humidity: 70%–80% / Rainiest month: July
Ba Ria Vung Tau monthly average temperature and precipitation
Month
Air temperature (°C)
Precipitation (mm)
January
26°C
0
February
26.6°C
0
March
27.6°C
0
April
29.2°C
0.1
May
30°C
5.6
June
28.6°C
6.2
July
27.4°C
11.5
August
28.1°C
5.1
September
27.3°C
9.3
October
27.3°C
7.9
November
27.2°C
2.1
December
25.7°C
4.2
Ba Ria Vung Tau weather for the next seven days
6/22
Monday
Patchy rain nearby
31.1°C/27.2°C
6/23
Tuesday
Patchy rain nearby
31.2°C/27.6°C
6/24
Wednesday
Moderate rain
31.4°C/27.7°C
6/25
Thursday
Moderate rain
31.2°C/27.7°C
6/26
Friday
Moderate rain
31.4°C/27.1°C
6/27
Saturday
Patchy rain nearby
30.4°C/27.3°C
6/28
Sunday
Patchy rain nearby
30°C/27.3°C
